- Double-click on the “Icon” of Shape of Economy on your Desktop.

- Now you are ready to use the software.

- Select Input (for example, Consumption, Income, Expenditure or Production)

- You can put values.

- You will see the change in graph after entering the values.

- On the bottom left side of the graph, you can see several types of graphs.
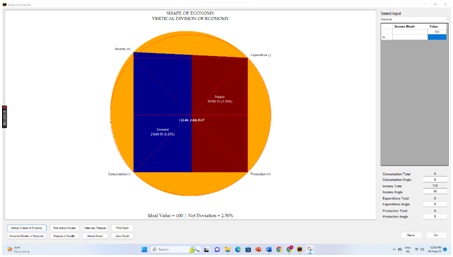
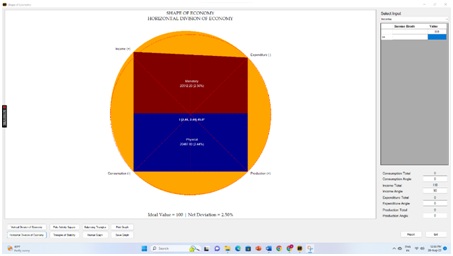


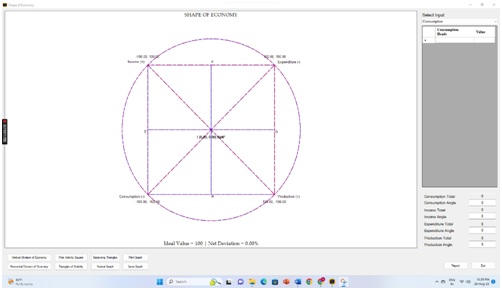

- To see the reports you can simply click on the “Report” button.
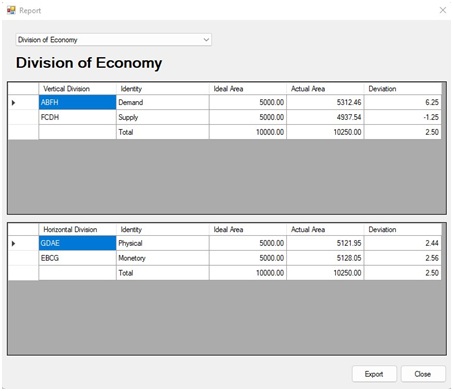
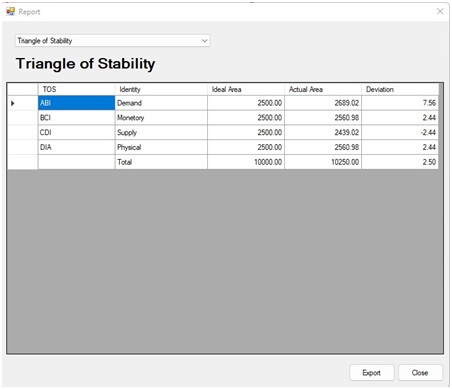
- There you can see results of Division of Economy, Pole Activity Squares, Triangles of Stability and Balancing Triangles.
(1)Division of Economy.
(2) Pole Activity Square.

(3) Triangle of Stability.
(4) Balancing Triangles.
